Excel tools, dashboards, scorecards, and models built to solve business problems.
Interactive training performance dashboard tracking employees trained, budget spent, and training metrics over time.
Real-time factory monitoring dashboard with machine status, material tracking, and utility usage metrics.
Dynamic salesperson scorecard with personal info, sales performance, product breakdown, and customer analysis.
Financial planning model for income, investment, and returns projection over 15 years.
Monthly executive report for contact centre KPIs across calls, chats, emails, and escalations.
Knowledge management dashboard tracking visits, articles, tickets, comments, and classification status.
Interface for procurement tool tracking supplier compliance, purchase cycle times, and partner classification.
Credit risk assessment dashboard UI with payment analysis, aged debt tracking, and risk scoring.
A customizable 5-zone gauge chart template combining pie and doughnut charts. Easily import into any workbook for professional data visualization.
A dark-themed dashboard tracking support team KPIs including occupancy rate, NPS, first contact resolution, and top agent performance with satisfaction scores.
Monthly scorecard tracking quality service and safety metrics for DC Metro, including on-time performance, fleet reliability, escalator reliability, and crime rate trends.
Regional dashboard analyzing historical avocado pricing and volume data across 8 US regions with sparkline trends and year-over-year comparisons.
An interactive Excel tool cataloguing 832 plants and their medicinal uses, with searchable plant names, local names, and botanical illustrations.
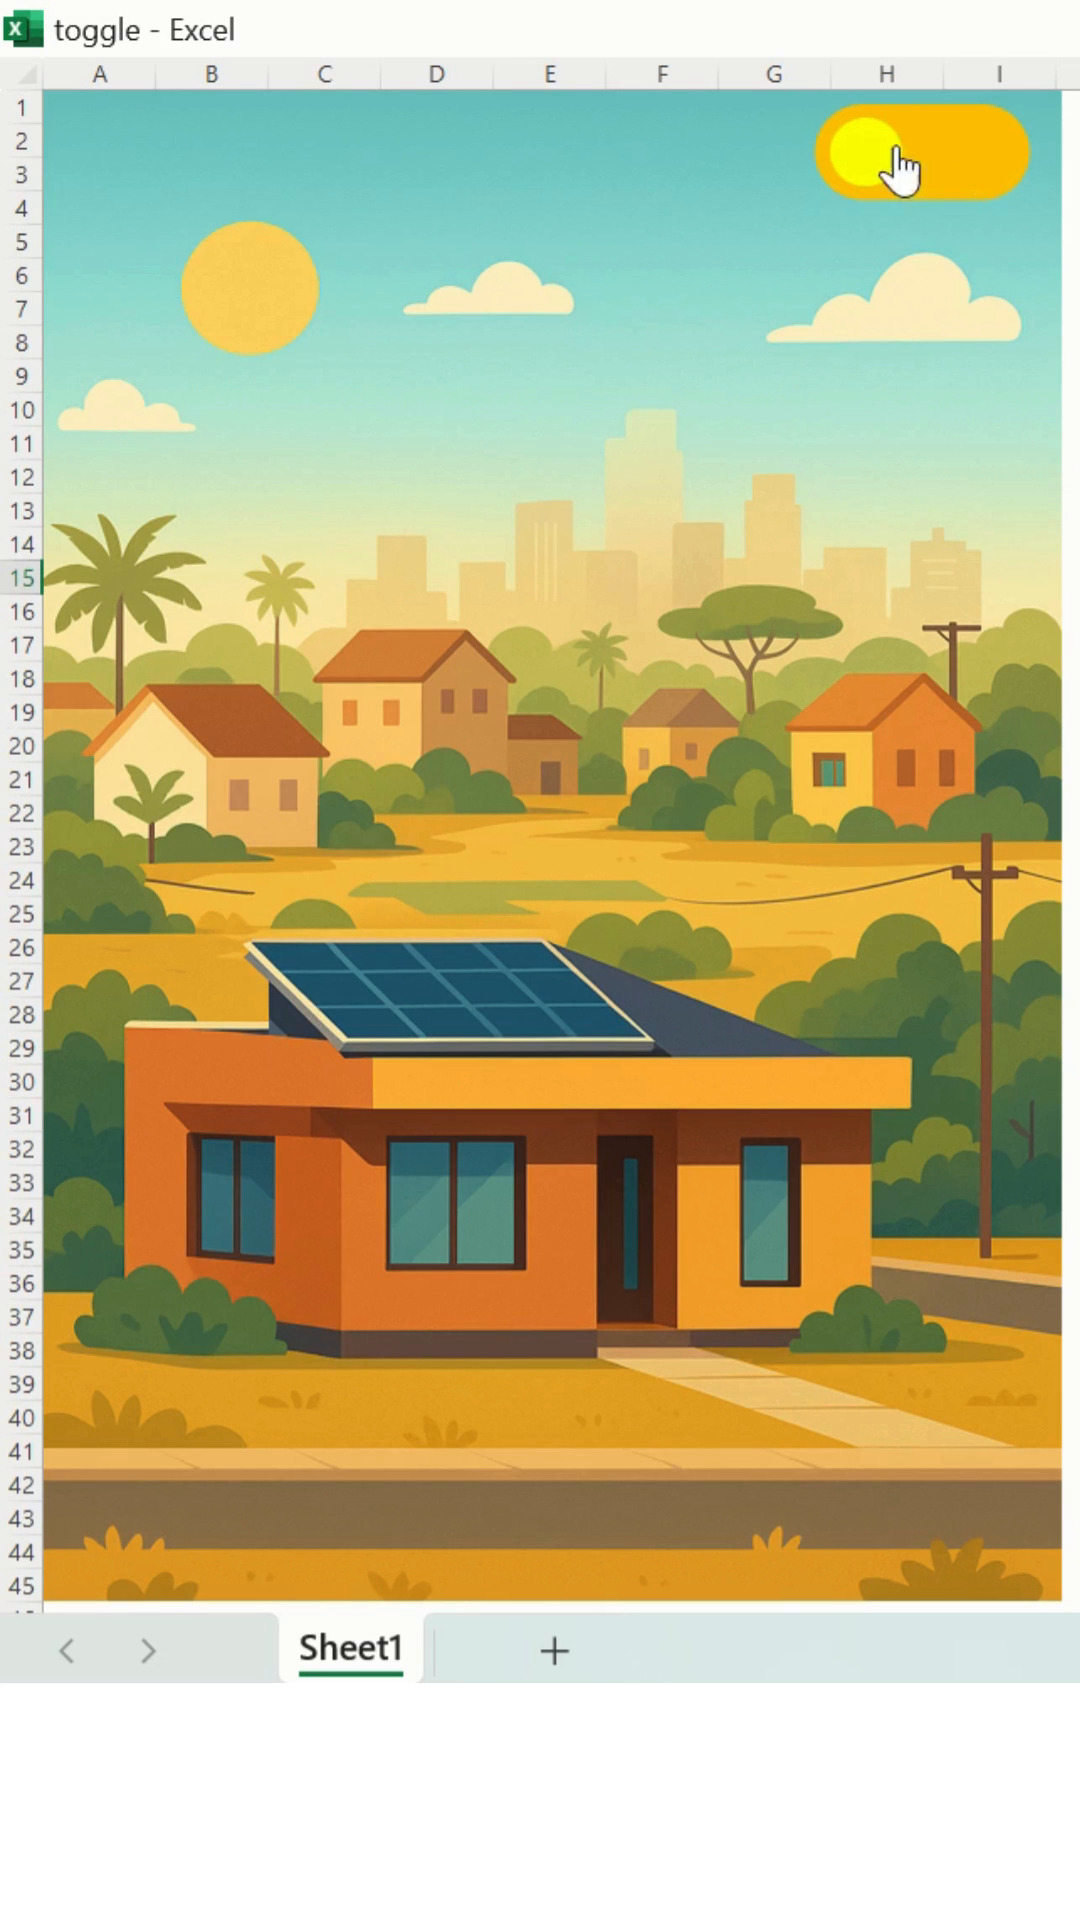
An interactive toggle that shows and hides sections of a worksheet for a cleaner, app-like Excel experience.
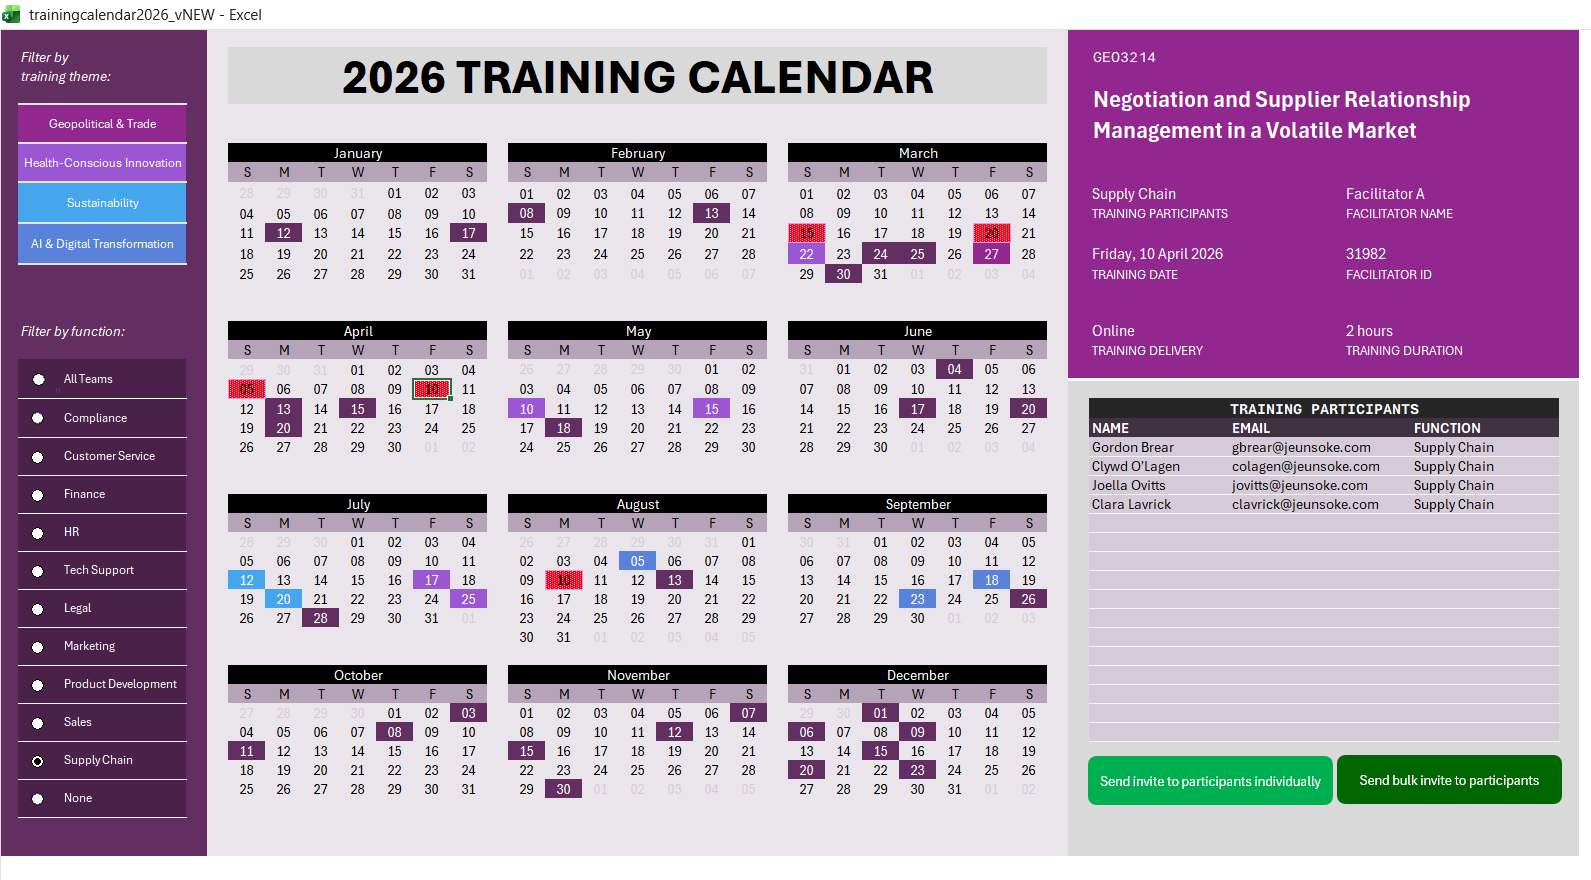
A learning and development dashboard tracking training completion, attendance and skill coverage across teams.
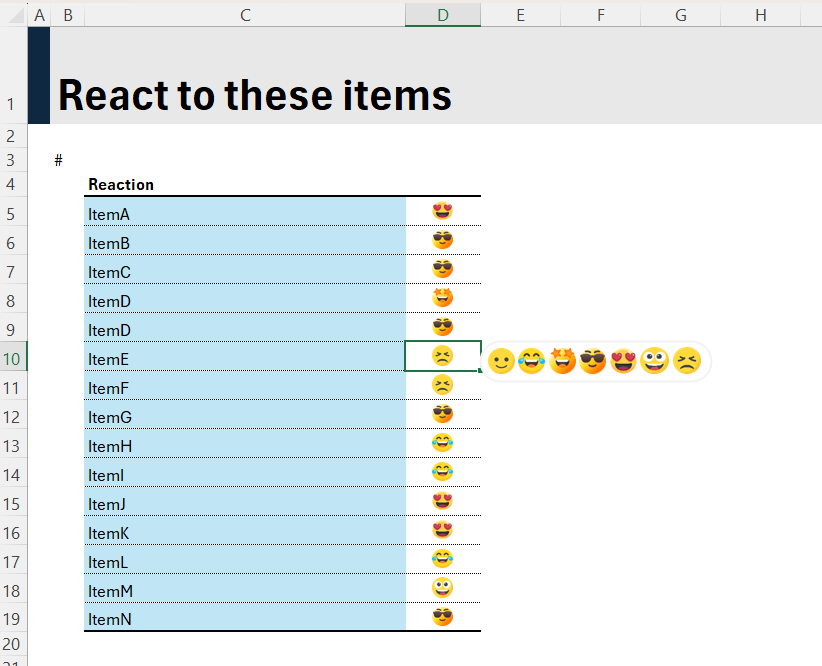
A feedback dashboard that visualises sentiment using emoji reaction scores.
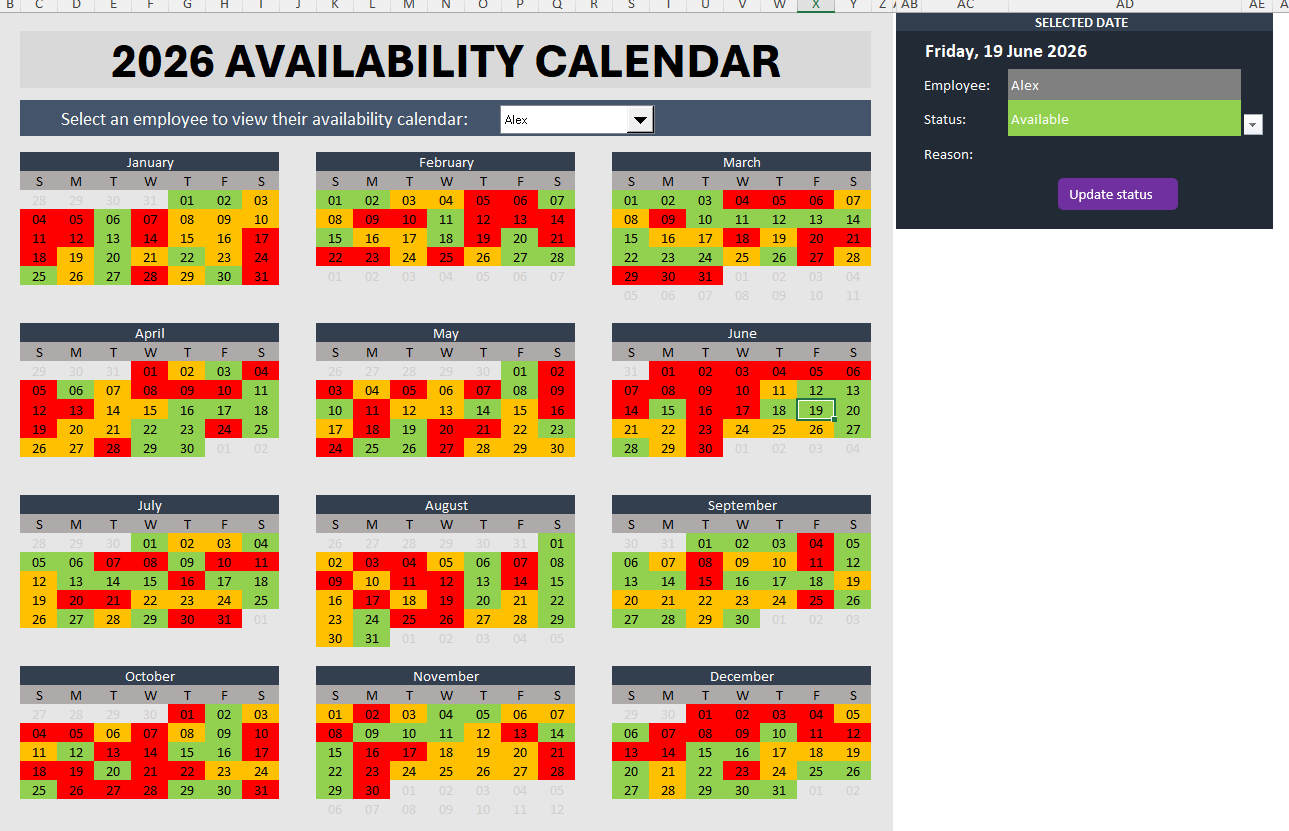
A calendar view of employee availability, leave and shift coverage across the month.
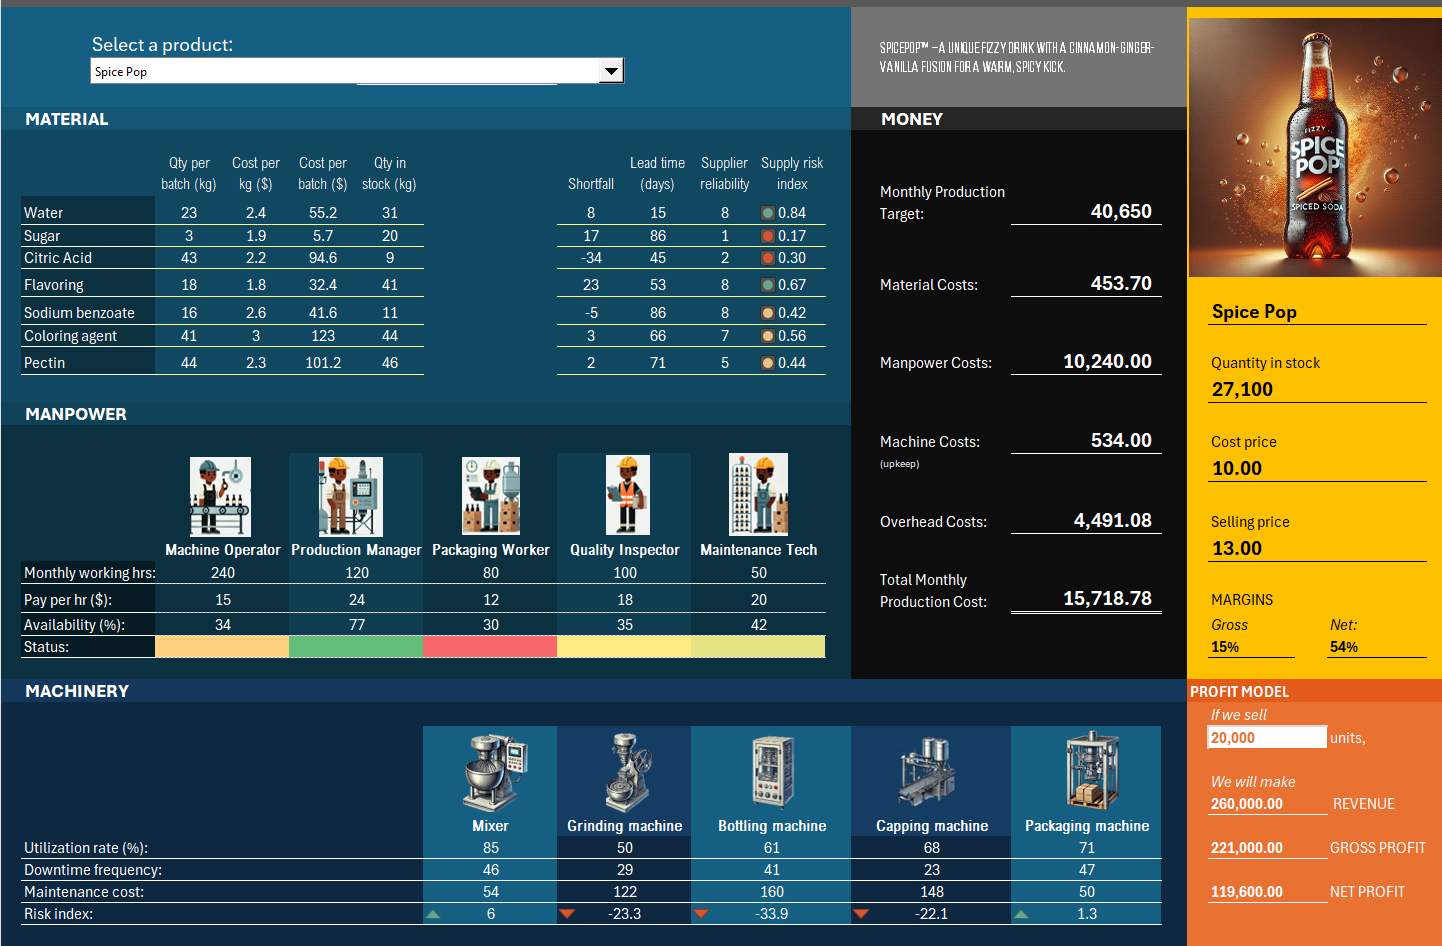
A bill of materials dashboard breaking down component costs and quantities for manufacturing planning.